
Affichage du trafic vers un référentiel

Toute personne disposant d’un accès en poussée (push) à un dépôt peut afficher son trafic, y compris les clones complets (pas les récupérations (fetch)), les visiteurs des 14 derniers jours, les sites de référence et le contenu populaire dans le graphique de trafic.

Qui peut utiliser cette fonctionnalité ?

This repository insights graph is available in public repositories with GitHub Free and GitHub Free for organizations, and in public and private repositories with GitHub Pro, GitHub Team, and GitHub Enterprise Cloud. It is not available on GHE.com.

You can navigate to referring sites, excluding search engines and GitHub itself, from the links the specific paths were referred from. The popular content links to the specific content that generated traffic.

Referring sites and popular content are ordered by views and unique visitors. Full clones and visitor information update hourly, while referring sites and popular content sections update daily. All data in the traffic graph uses the UTC+0 timezone, regardless of your location.

Conseil

You can hover over a specific day in the traffic graph to view the exact data for that day.

Screenshot showing two line graphs for repository traffic. The lines are marked with dots for specific dates.

Accessing the traffic graph

  1. On GitHub, navigate to the main page of the repository.

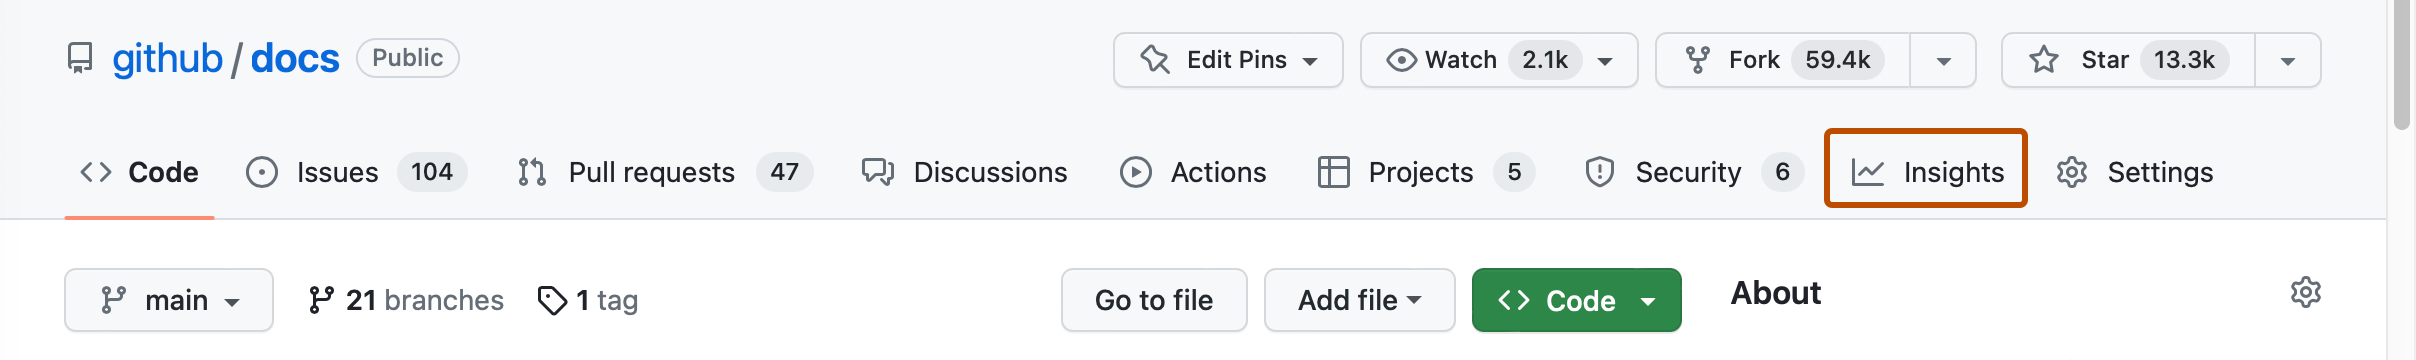
  2. Under your repository name, click Insights.

    Screenshot of the main page of a repository. In the horizontal navigation bar, a tab, labeled with a graph icon and "Insights," is outlined in orange.

  3. In the left sidebar, click Traffic.

Screenshot of the "Traffic" tab. The tab is highlighted with a dark orange outline.